What is a single-line diagram, and why it matters before you file
If you've never filed an interconnection application before, the first time a utility asks for a single-line diagram can feel like a pop quiz you didn't study for. The SLD is the document that tells the utility engineer what you're proposing to connect to their grid, and most interconnection portals won't let your application move past intake without one.
What a single-line diagram actually shows
A single-line diagram (SLD) is a simplified electrical drawing that represents your whole system, from the PV array through inverters, disconnects, metering, and the point of interconnection, as a single line rather than three-phase conductors. Think of it as a summary-level ratings map, distinct from a full construction set or a wiring schematic. It shows inverter model and AC output, conductor and conduit sizing at a summary level, overcurrent protection, transformer configuration if there is one, and the exact point where your system ties into the building's electrical service or the utility's distribution feeder.
Utility reviewers use it to check things fast: does the proposed interconnection point have enough capacity, does the protection scheme match their standards, is this a load-side or supply-side connection, and does the AC nameplate rating match what you declared on the application form. A clean SLD that answers those questions on sight gets a faster technical review. A messy one, or one that's missing the interconnection point entirely, gets kicked back with a request for more information, and that resets your place in the queue.
Why it matters before you file, not after
Most interconnection application requirements for C&I solar bundle the SLD in with site plans, equipment spec sheets, and a utility-specific application form. The mistake we see across portfolios is treating the SLD as the last thing an EPC drafts before submission, almost as a formality. By the time someone sits down to draw it, the system size and inverter selection are already locked in from an earlier site walk or a rough irradiance estimate. If the usable roof area turns out smaller than assumed, or the array has to be split across two roof sections with different orientations, the diagram has to be redrawn and the application resubmitted.
That rework is expensive on a single building. Across a portfolio of twenty or fifty sites being screened for PPA bids, it's the difference between hitting a bid deadline and missing it. An electrical diagram for a solar PPA bid is only as good as the system size it's drawn around, and the system size depends on how much of the roof is actually usable once you account for HVAC units, skylights, fire setbacks, and shading from parapets or adjacent structures. Get that number wrong early and every downstream document, SLD included, has to be touched again.
Where roof screening fits before anyone opens a CAD file
This is the part that usually happens too late in a portfolio workflow. Engineering teams draw single-line diagrams for sites that haven't been properly screened for installable capacity, because the screening was a desk estimate based on square footage rather than actual usable area, orientation, and obstruction. The SLD should be drawn once the site's real kWp potential is known, before engineering hours get spent, not after.
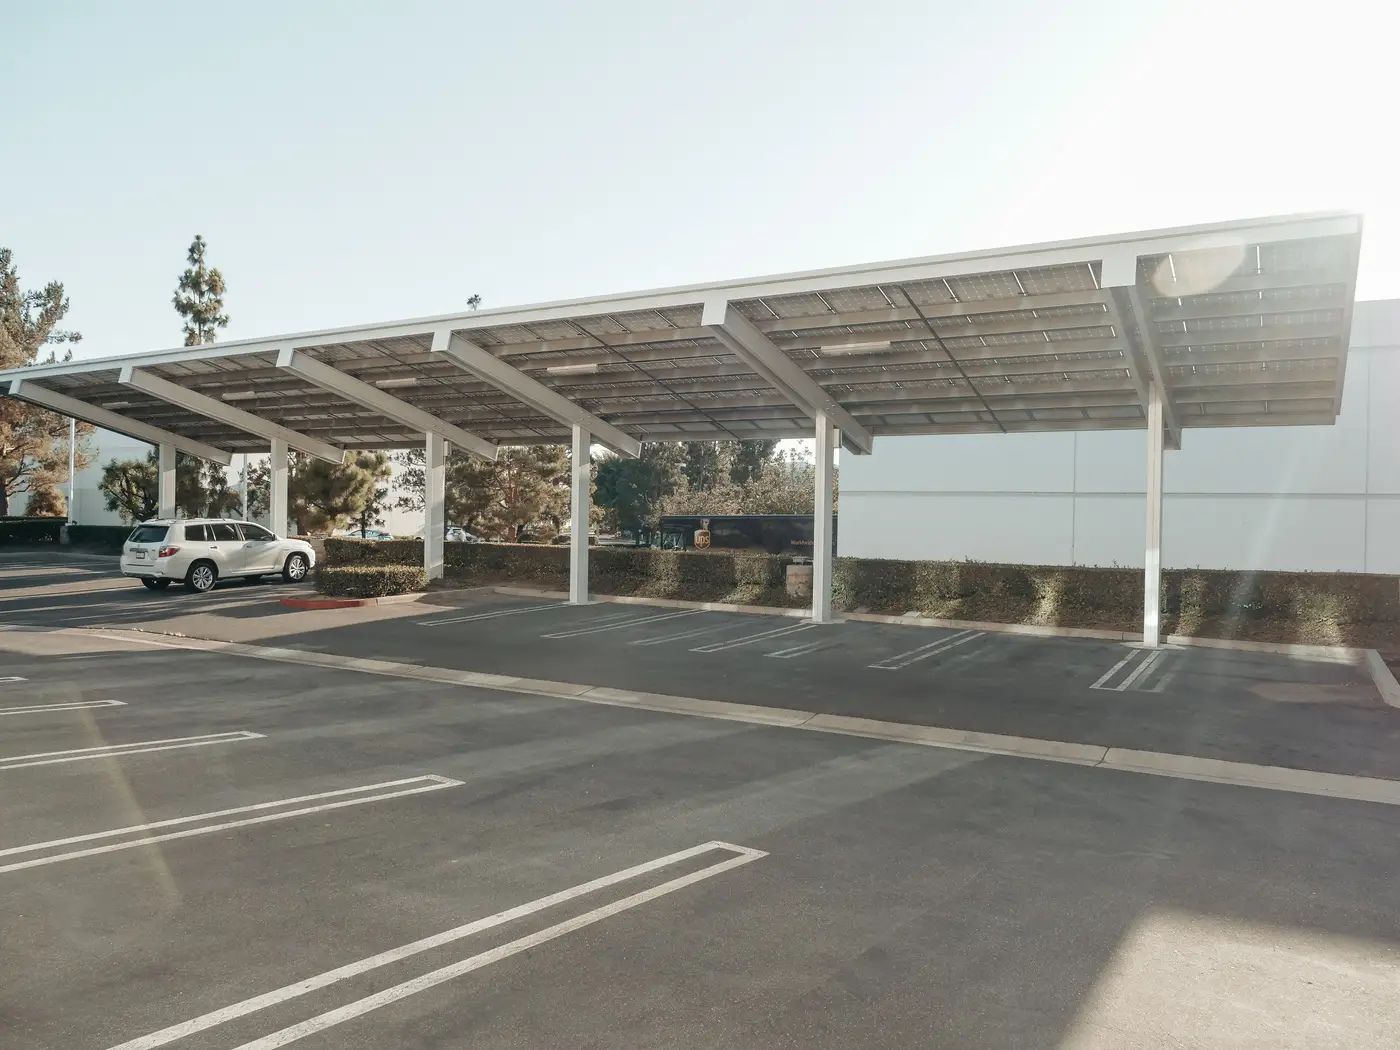
Rooftop Solar Suitability is built for the step before the diagram: it rates every roof and parking canopy in a portfolio for usable area, orientation, and obstruction, and hands back installable kWp per site instead of raw square metres. That's the number an EPC needs before they size inverters and draw the SLD, and it's the number that keeps you from committing engineering hours to a site that won't pencil out once the obstructions are accounted for properly.
A quick gut check before you submit
Before an SLD goes into an interconnection application packet, confirm three things line up: the AC nameplate capacity matches the application form, the point of interconnection is drawn exactly where the utility's one-line standard expects it (load side versus supply side matters), and the system size matches the roof's current usable area as confirmed by survey, since early square-footage estimates tend to run high once real obstructions get mapped. If any of those three are still fuzzy, the diagram isn't ready, no matter how clean it looks.
If you're ranking a portfolio and want the installable kWp numbers settled before anyone starts drawing diagrams, take a look at how Rooftop Solar Suitability screens a portfolio before the site-visit shortlist.